Election Years – Value vs. Growth
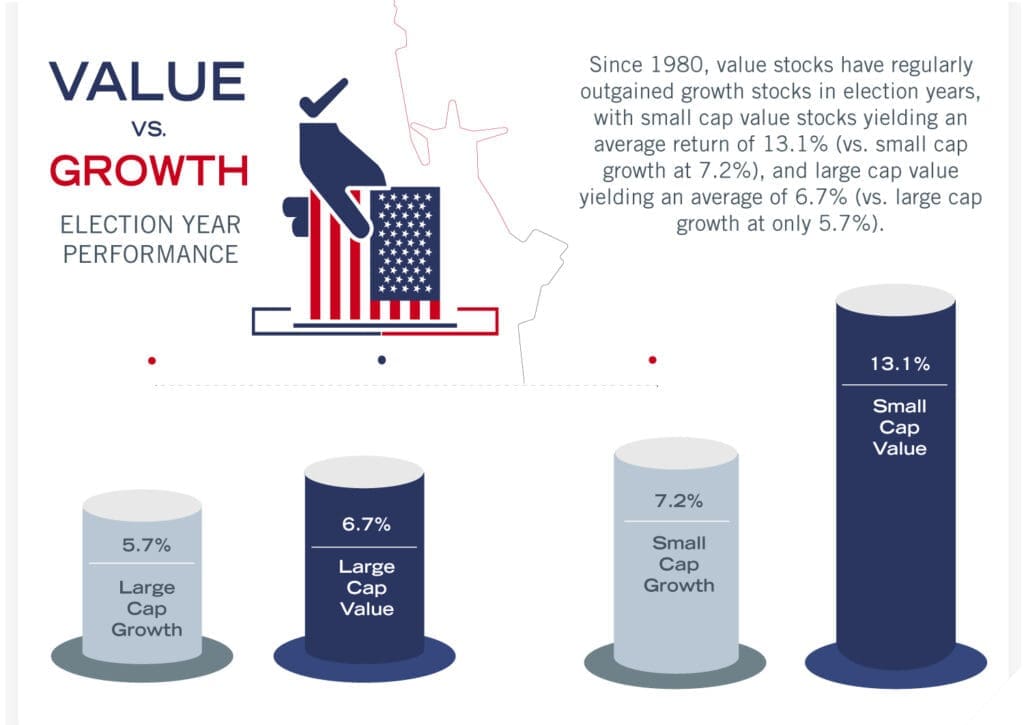
We examine the historical trend of value stocks outperforming growth stocks during election years, a pattern evident since 1980 and is particularly pronounced in small cap stocks.
As we close in on this year’s election, investors are keenly assessing their portfolios, seeking information to help navigate the uncertainty and changes ahead. One pattern that has emerged over the past four decades is the consistent outperformance of value stocks over growth stocks during election years, a trend that is even more pronounced when we delve into smaller cap stocks.
| ANNUAL RETURNS | ||||
| ELECTION YEAR | LARGE CAP VALUE | LARGE CAP GROWTH | SMALL CAP VALUE | SMALL CAP GROWTH |
| 1980 | 16.3% | 35.2% | 19.0% | 49.4% |
| 1984 | 3.5% | -3.9% | -1.4% | -17.0% |
| 1988 | 17.2% | 8.5% | 26.0% | 18.8% |
| 1992 | 9.4% | 2.7% | 26.3% | 6.8% |
| 1996 | 18.1% | 21.5% | 18.4% | 10.7% |
| 2000 | 4.9% | -22.8% | 19.6% | -22.7% |
| 2004 | 13.7% | 5.2% | 20.1% | 13.8% |
| 2008 | -38.8% | -39.3% | -30.6% | -39.0% |
| 2012 | 14.5% | 13.3% | 15.5% | 13.7% |
| 2016 | 14.3% | 5.3% | 28.9% | 10.4% |
| 2020 | 0.1% | 37.1% | 2.4% | 33.8% |
| Average | 6.7% | 5.7% | 13.1% | 7.2% |
Source: Bloomberg. “Large” stocks are represented by the Russell 1000 Index. “Small” stocks are represented by the Russell 2000 Index.
COMPELLING NARRATIVE
Since 1980, data reveals value stocks have not only held their ground but have outperformed their growth counterparts amidst the electoral cycle’s unique market dynamics. This phenomenon can be attributed to several factors, each playing a critical role in shaping investor behavior and market outcomes.

Source: Bloomberg. “Large” stocks are represented by the Russell 1000 Index. “Small” stocks are represented by the Russell 2000 Index.
THE VALUE PROPOSITION
Value stocks, characterized by their lower price relative to fundamental business metrics such as earnings or book value, often represent mature companies with stable cash flows and dividends. These stocks tend to be less volatile, offering a semblance of safety against the backdrop of political uncertainty.
ELECTION YEAR DYNAMICS
Election years introduce a level of unpredictability that can unsettle markets. Policy changes, regulatory shifts, and the potential for significant alterations in the business environment make investors cautious. In this climate, the steady, reliable returns of value stocks become increasingly attractive. The promise of growth stocks, with their speculative future earnings and higher volatility, seems less appealing in comparison.
GOING DOWN CAP: A STRONG CASE FOR VALUE
The outperformance of value stocks over growth stocks becomes even more pronounced as we move down the market capitalization spectrum. Small cap value stocks, in particular, have shown remarkable resilience and growth potential during election years. These companies, often more nimble and locally focused, may benefit from specific policy changes or economic shifts that elections can herald. Their undervaluation, coupled with the potential for significant upside, makes them a compelling choice for investors looking to capitalize on election-year dynamics.
2024 – SO FAR…
Large cap tech stocks – especially those linked to AI – have dominated market preferences, attracting immense investor attention and driving significant gains. These “Magnificent 7” stocks have benefitted from the excitement surrounding AI and innovation, pushing growth stocks to elevated valuations.
Despite this enthusiasm, a shift has been quietly emerging since the midpoint of 2024. Small cap stocks, particularly small-cap value, have started to make a comeback, as investors look beyond the stretched valuations of large cap tech and seek opportunities in undervalued sectors. This rotation has been supported by attractive valuations in small cap value and a broader market rebalancing.
Though we are still far from the end of the year and face the uncertainty of upcoming elections, the momentum in small cap value stocks is beginning to follow the historical trends seen in previous election years. This developing trend could signal the start of a broader rotation, offering potential opportunities for investors looking to diversify away from top-heavy indices.
Certain information contained in this communication constitutes “forward-looking statements”, which are based on Cambiar’s beliefs, as well as certain assumptions concerning future events, using information currently available to Cambiar. Due to market risk and uncertainties, actual events, results or performance may differ materially from that reflected or contemplated in such forward-looking statements. The information provided is not intended to be, and should not be construed as, investment, legal or tax advice. Nothing contained herein should be construed as a recommendation or endorsement to buy or sell any security, investment or portfolio allocation.
Any characteristics included are for illustrative purposes and accordingly, no assumptions or comparisons should be made based upon these ratios. Statistics/charts and other information presented may be based upon third-party sources that are deemed reliable; however, Cambiar does not guarantee its accuracy or completeness. As with any investments, there are risks to be considered. Past performance is no indication of future results. All material is provided for informational purposes only and there is no guarantee that any opinions expressed herein will be valid beyond the date of this communication