2018 Market Review and 2019 Outlook
Cambiar President Brian Barish reflects back on a volatile 2018 and outlook for this year.

2018 was a punishing year for most investors, with negative returns from almost all asset classes. Stocks lost value in almost all major global regions, and the U.S. dollar appreciated against most currencies, amplifying non-USA losses. Bonds generally lost value as yields rose around the world, and most commodities also declined in value. The fourth quarter of 2018 saw these losses mount, as an explosive sell-off in December triggered a 14% decline for U.S. large-cap stocks (as measured by the S&P 500 index), a 20% decline for U.S. small caps (Russell 2000 index), and a 13% decline for international (MSCI EAFE index). Japanese savers outperformed the world, as the net gain on the yen (approximately 2% versus the dollar) appears to have outperformed all other conventional investments.
It is reasonably evident as a Monday morning quarterback how to look at the developments over the course of the year. Following a blow-off top at the beginning of 2018, tighter liquidity, poor news flow, and a higher risk-free interest rate pulled all manner of financial assets lower. In 2017, markets moved north in a synchronized manner with historically low volatility. The global economic outlook was hailed as being unusually sunny and pleasant, and abundant liquidity pushed global equity markets to new post-GFC highs in January 2018. Following this brief euphoria, markets resided in negative territory for eight months of the year and plunged in altogether in the fourth quarter, with record mutual fund outflows. Total losses pushed into 20%+ bear markets for all equity asset classes excepting the S&P 500, which bottomed at -19%. The declines are quite similar to the 2011 market rout, proximally caused by a monetary shock (Euro crisis, U.S. sovereign debt downgrade), albeit times have changed seven years later.
What Caused the Rout?
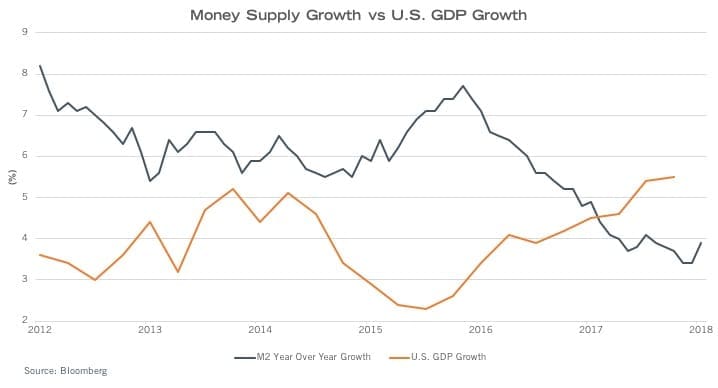 I believe the primary cause was a combination of elevated expectations at the onset of 2018 and deteriorating money supply growth. With U.S. nominal GDP growth in excess of 5% for much of 2018, and money supply growth clocking in at ~3% due to monetary tightening by the U.S. Federal Reserve, liquidity came out of stocks and into the non-financial economy, a phenomenon called the “Marshallian K” (named after an early 20th century economist). In Marshallian terms, we had a money supply deficit and the plug variable are outflows from financial assets – which explains the poor performance from within stocks, bonds, commodities, and currencies. A poor political tone and the ongoing threat of a global trade war escalation (with no particularly clear path to resolution) did not help sentiment and affected investor behavior. The threat of tariff escalation may have bunched some capital goods and finished product orders over the course of the year, creating non-linear demand spikes and declines that an increasingly quantitatively driven financial system does not compute with ease. But trade noise and other questions of political intentions were also part of the landscape in 2017 – it’s difficult to argue with consistency that these became altogether stronger factors in 2018.
No Powell Put?
Stock markets since the 1987 crash have grown accustomed to immediate Fed soothing actions – in the form of words or deeds – once stresses emerged. This has not necessarily prevented bear markets or the great crash of 2008 (and may have contributed to some of the moral laxity that precipitated the precipitous financial declines of the 2000s), but it has been the norm. With markets under material pressure in early December, the Fed under new Federal Reserve chair Jerome Powell surprised investors with a plan to continue its balance sheet roll off and multiple forecasted 2019 interest rate increases. This roiled already poor confidence and fed into a computer-driven and tax-loss selling motivated rout, climaxing on Christmas Eve. As monetary policy renormalizes, it is unclear whether equities and bonds need to reprice the absence of a Fed put option in coming years, or at least a higher threshold for it.
Outside the U.S., international markets fared poorly throughout the year. Non-U.S. markets were already in the red on a year-to-date basis by the beginning of the fourth quarter, and proceeded to fall in lockstep with U.S. stocks as markets sold off in an increasingly disorderly fashion. European equities retraced fully the advance from 2016 lows, while Japanese stocks fell back to early 2017 levels at the end of the year. A stronger dollar and higher competitive interest rates in developed markets raise funding costs for Emerging Markets, leading to capital outflows and currency pressure. In all probability, the same negative drivers of elevated expectations and diminishing money supply growth drove asset prices lower. However, a poorer growth narrative was also a critical factor.
Emerging Markets as an asset class and growth engine have come to be dominated by China, whose size and economic depth dwarves the rest of the EM universe. China’s economy remains a hybrid of state control and government-sponsored companies, along with highly competitive free-enterprise companies. The financial system behind this is opaque, with inconsistent regulation and business practices. In mid-2018, as part of efforts to limit capital outflows and systemic risks, the Chinese government cracked down on shadow lending businesses and other grey market financial schemes. Lending through these channels declined by over 70% by some estimates during the year. In economic terms, this was a moderate sized “monetary shock”. Chinese buying patterns for large ticket items such as cars, watches, and apartments declined materially in response to less available financing. Chinese auto sales declined by as much as 4 mm units from early 2018 forecasts (to the 24 mm range from a 28 mm unit level) – playing havoc with supply chains for auto parts, semiconductor chips, and other materials.
China and the U.S. are the world’s engines of economic growth, as the rest of the world is either not big enough or too stagnant to matter appreciably. China’s longer-term growth trajectory is bound to be lower than what it has been to date, as moving further up into higher value-added production and services industries is not easily centrally planned. Investors rightly fear that if Chinese growth becomes outright stagnant, so too will be the end markets for a variety of key industrial, commodity, and technology products. Visible signs of slowing, even if somewhat self-induced in 2018, are cause for caution, as is an aggressive Fed tightening and balance sheet run off in the U.S. Net, it seems that for the visible future, cyclical businesses will continue to key off the direction of the world’s two largest economies.
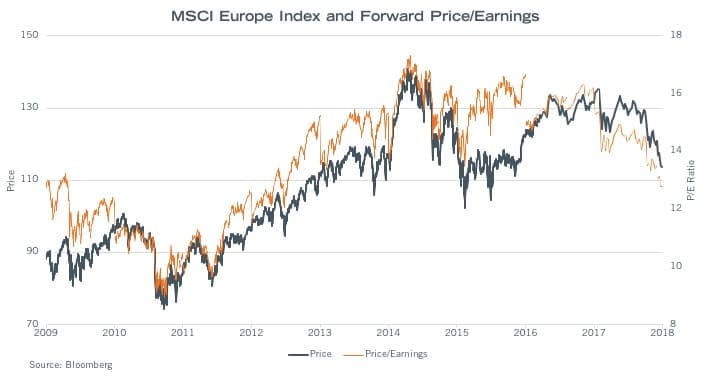 European stock market performance was particularly poor for 2018, with the MSCI Europe index declining by 17% in dollar terms at year’s end, and by 25% from highs reached in January 2018. In raw stock price terms, European averages have failed to advance since August 2009 (as measured in dollars)…an astonishing record of futility. This statistic casts the discussion in a somewhat darker light than is entirely fair, as European dividend yields are high (3.85% currently), and the Euro currency has gone from an overvalued state in 2009 to an undervalued state versus the U.S. dollar. European economic growth rates are structurally lower relative to the U.S. and Asia, largely a function of near-zero population growth, high wealth levels already, and a lot of dependence on exporting to other corners of the world. Loosely speaking, economic potential is about half of American economic potential, if not a bit less. European growth rates fell from nearly 2% in late 2017 to borderline flat levels now. We have seen this pattern before; it is not necessarily a prelude to a contraction, but more consistent with low structural growth in the region. Nonetheless, coupled with governments in the U.K. and Italy’s best efforts to scare investment capital from the region, stocks and valuations plunged in 2018. The net result was a contraction in the P/E multiple of the European market to the 12x level, last seen during the peak Euro-crisis period.
It has been a long and dark “lost decade” for European stocks, dominated more by exasperating sovereign nuisances than great corporate stories of value creation. The survivors are, we think, some very strong businesses on balance. Key uncertainties that have stretched investor patience to the limit are poised to resolve in 2019, which ought to unlock what appears to be trapped value, broadly speaking.
Market Structure: “Mr. Market” Does Not Live Here Anymore
“Mr. Market” is a character created by investor Benjamin Graham, and often cited by Warren Buffett in his older writings. Per Wikipedia, “Graham asks the reader to imagine that he is one of the two owners of a business, along with a partner called Mr. Market. The partner frequently offers to sell his share of the business or to buy the reader’s share. This partner is what today would be called manic-depressive, with his estimate of the business’s value going from very pessimistic to wildly optimistic. The reader is always free to decline the partner’s offer, since he will soon come back with an entirely different offer.” Buffett similarly referenced Mr. Market to explain the sharp shifts in stock market sentiment, risk appetite, and short term investing fads. I always pictured Mr. Market to be a Woody Allen-like character – a bit nerdy, neurotic, reasonably well-educated, yet chronically inconsistent and prone to whims. Buffett seemed to view the character more as a farm owner down the road who was always in the market for farmland, but wildly inconsistent in what he might pay. Perhaps he had a particular fellow in mind.
A threshold will be crossed at some point in 2019, as indexed assets will breach 50% of the total U.S. stock market (barring some sharp shift in this trend which I currently don’t see occurring). Mr. Market holds convictions as to the value of businesses and what kinds might appreciate, even if these are fluid and inconsistent. A passive index does not possess such convictions, as there is no price-discovery or reaction to changes in business fundamentals. Rather, an index will essentially piggyback off the decisions of an ever-decreasing pool of active investors. In a mood shift, all stocks are for sale, or all stocks are to be bought, with little in between. In a world that now seems rather distant, retail investors and trend-hugging mutual funds, tended to personify the neurotic and whimsical features of Mr. Market, frequently piling into crowded forms of speculation only to change course and risk appetite, often with poor timing.
While not yet eradicated completely from market structure, the omnipotence of index flows and the impact on market pricing signals is becoming difficult to cast aside as inconsequential. At more than half of equity ownership, a liquidation decision by Mr. Index Funds would overwhelm what’s left of liquid investment capital, leading to some very significant questions about the market’s capacity to clear positions. This is evident in market breadth statistics from the fourth quarter market flush. There have been three distinct (but short-lived) global equity bear markets since the GFC low in early 2009: the 2011 Eurozone crisis, the 2015-16 time period (dominated by a stronger dollar and commodity price declines), and the 2018 decline, with Fed Quantitative Tightening (QT), interest rate renormalization, and trade fears probably going down as the likely causes. In the other two prior bear markets, clear evidence of credit stress emerged in the most affected assets, such as Mediterranean sovereign debt in 2011, or U.S. high yield debt for commodity-oriented companies in 2015. There has been scant evidence of credit stress this time around – just a poor tone and loss of upward momentum. At the 2011 and 2015 market lows, about 30% of stocks hit their low for the year at the market low, and ~70% of stocks traded below their 200-day moving averages. In December 2018, over 50% of stocks hit their lows for the year, and over 90% fell below 200-day moving averages…suggesting there was nowhere to hide and that cash was the only practical defense mechanism. Imagine if there had been credit stress! Away from market movements and an incapacity to absorb sudden liquidity flows out the door, there are mini-crashes on almost a daily basis, as quantitative and computer-driven programs push individual stocks around news events, earnings releases, and changes in ETF flows. It doesn’t look like or feel like Mr. Market’s frequent mood shifts. It feels like something else, a robot curating news stories and pushing on momentum, or short term derivatives contracts being hedged and re-hedged into thinner and thinner liquidity.
From the lens of the Mr. Market allegory, our quirky friend down the road has become old and lost a few steps, and seems to have a chronic cough that just doesn’t sound very good. He is still the same guy and yet not really the same anymore, transacting much less frequently and much less interested in being bothered. His demise is not imminent, but this fellow may not have that much longer with us; it’s hard to say. While ever imperfect, the pricing and feedback mechanism that public equity markets have represented for the better part of two centuries does work to channel capital and breathtaking rewards for success to those with the best ideas, products, and business execution, propelling the inherent value of business formation and expansion forward broadly. The passive blob that is replacing it seems to be doing a great job at rewarding size, leading to a top-heavy market prone to volatility episodes on short notice. It does not have a great feel to it.
2019+ Investment Views
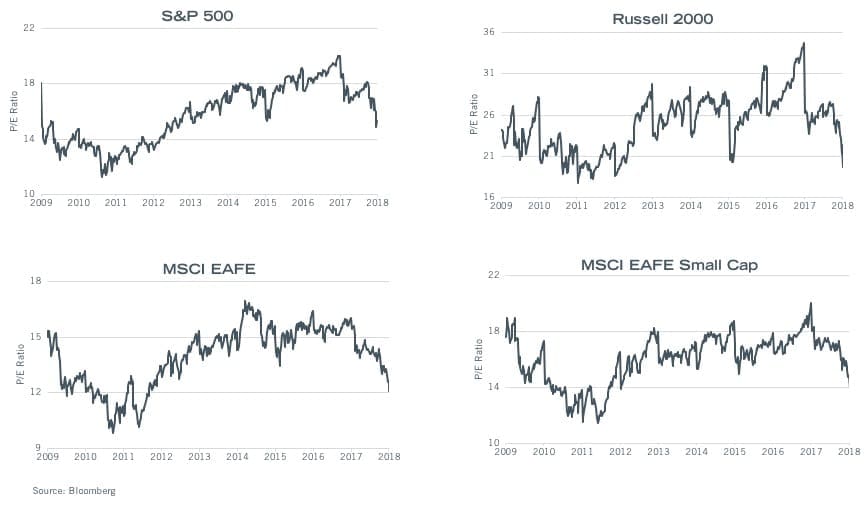
We are optimistic that returns in 2019 and perhaps into 2020 will be a good deal improved, if for no better reason then the starting point is notably low. Just squint at the following charts of P/E multiples for the U.S. and International equity markets. All have reverted back to 2012-2013 levels, a time period that was notably attractive for forward returns.
At the end of the third quarter, we wrote that current markets are reminiscent of broader global market conditions in late 2011-2012, when valuations remained compressed for just about everything, from tech to banks to industrials to durable goods. Not much changed in Q4, it only got more acute! Over the course of 2019, we anticipate several current hangnails will be resolved, such as Brexit, a populist government in Italy, and the ECB’s lift-off from NIRP monetary policy (NIRP is being more widely criticized as ineffectual and contractionary from a variety of economists across the ideological spectrum). It’s a bit less clear whether China and the Trump administration can agree on a trade package, and also a bit less clear whether the Federal Reserve will halt interest rate hikes and balance sheet shrinkage entirely in 2019, though they seem to be on hold for the first half. If, as argued, a deficiency of money supply growth relative to nominal GDP growth acted to draw capital out of financial assets, some combination of slowing U.S. GDP, better money supply growth from a quiet Fed, and better money supply growth ex-USA would act as positive catalysts throughout the year.
From an investment temperament point of view, in markets that are broadly speaking cheaper than they have been in 6-7 years, there ought to be a wide range of stocks that are capable of working. Rather than assuming a pro-cyclical or defensive posture, we tend to think portfolio balance is the best approach to attacking the opportunity set. Similarly, although the growth/value divide has remained an acute source of frustration on the value side of the ledger, our posture is to stay reasonably agnostic to what are and are not traditional value or growth stocks, taking the opportunities as they come to us. Cambiar was fairly active (though not hyperactive) in the fourth quarter, adding new positions and in some cases exiting stocks we viewed to be more vertically challenged. We plan to do mostly more of that over the course of the new year, understanding that as the journey back from years of quantitative easing and unconventional policy to a more normal cost of capital there may be aftershocks that have little to do with Mr. Market’s moods, and more to do with a very different market structure and/or a very different counterparty.

Thank you for your continued confidence in Cambiar Investors.
Certain information contained in this communication constitutes “forward-looking statements”, which are based on Cambiar’s beliefs, as well as certain assumptions concerning future events, using information currently available to Cambiar. Due to market risk and uncertainties, actual events, results or performance may differ materially from that reflected or contemplated in such forward-looking statements. The information provided is not intended to be, and should not be construed as, investment, legal or tax advice. Nothing contained herein should be construed as a recommendation or endorsement to buy or sell any security, investment or portfolio allocation.
Any characteristics included are for illustrative purposes and accordingly, no assumptions or comparisons should be made based upon these ratios. Statistics/charts may be based upon third-party sources that are deemed reliable; however, Cambiar does not guarantee its accuracy or completeness. As with any investments, there are risks to be considered. Past performance is no indication of future results. All material is provided for informational purposes only and there is no guarantee that any opinions expressed herein will be valid beyond the date of this communication.