Key Factors of the Decade
Is there something wrong with value investing? Cambiar President Brian Barish provides his thoughts as well as reflects back on the 2010s.
More thoughts on this later…
2019 Stock Price Developments – These Appear to be a Monetary Phenomenon
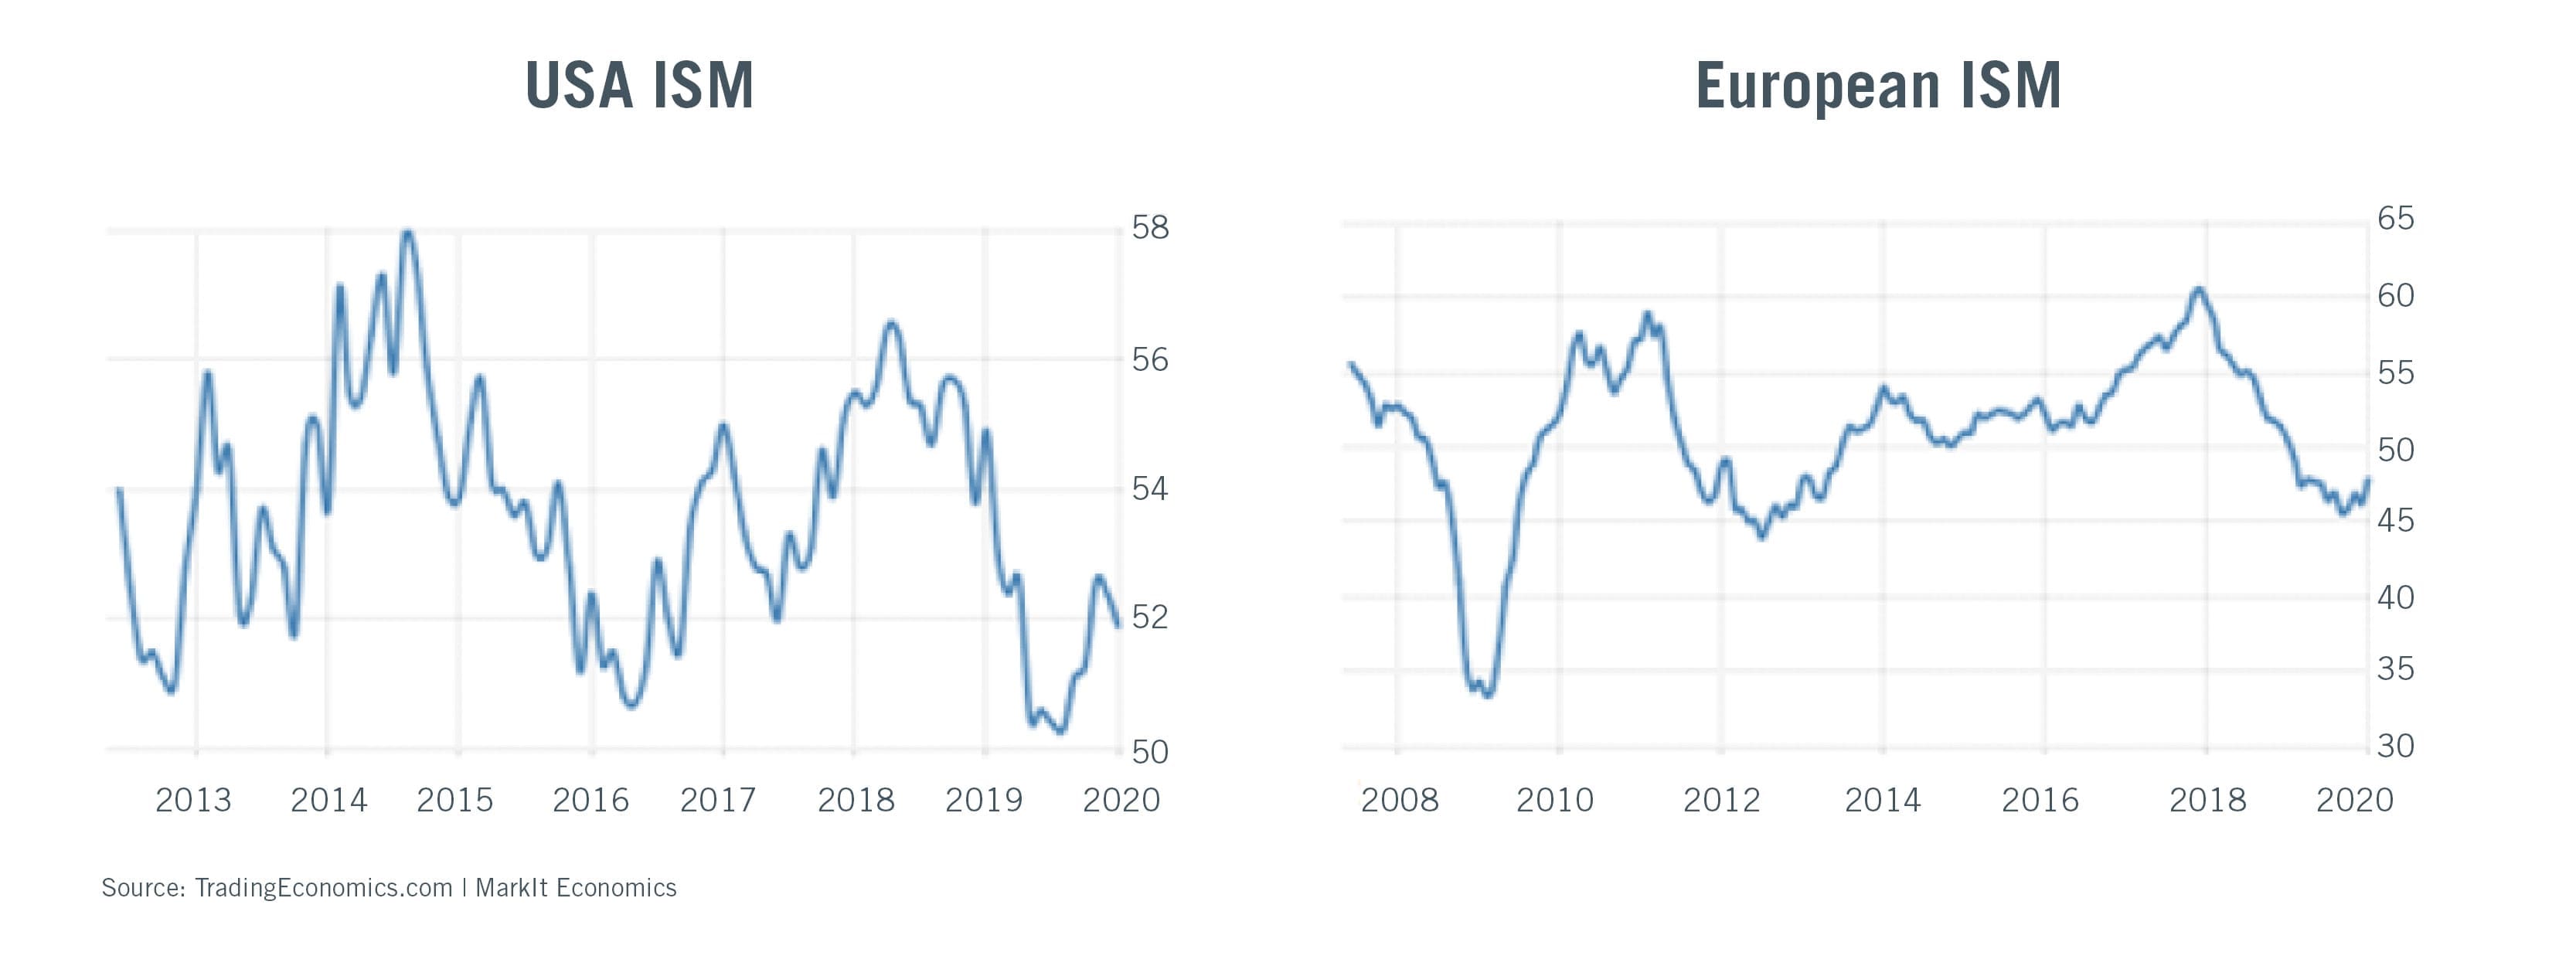
Stocks performed well in 2019 largely because they became more expensive, with the price-to-earnings multiple of U.S. stocks rising from approximately 14.5x to about 19x one-year forward earnings at the end of 2019. Earnings growth within the S&P 500 index was minimal, and not a lot better outside the U.S. The difference-maker has been money growth and flows – as and when money supply growth re-accelerated upwards in early 2019 from a distinctly rough 2018, stocks performed well. Over the course of 2019, the economic and earnings narratives were distinctly negative, as trade friction and fears had a paralyzing effect on global business capex and discretionary spending, leading to significant declines in physical inventories in a broad range of categories. This had implications upstream in global supply chains, with bulk commodity/materials volumes generally declining. The ISM index does a good job of assessing business conditions for physical volume/manufacturing-oriented companies. It declined serially throughout 2019, bottoming out in the high 40s for the U.S. and in the lower 40s for Europe. Readings below 50 suggest a majority of surveyed manufacturers are seeing/experiencing contracting business volumes. The basic observation is weakness in global manufacturing and trade stands in stark contrast to rising equities and equity valuations, suggesting other forces are at work.
If 2019 started at the bottom of a logical valuation range for global stocks, 2020 appears closer to the upper end, especially in the U.S., and a more conservative mentality is probably warranted. In the very short term, the impetus from money supply growth exiting 2019 may overshadow this – the liquidity faucet remains in the “on” position, and this may/should influence stocks. We will be monitoring this very closely. Should the Fed tap down on money supply growth, stock valuations leave little room for error. That said, the preponderance of valuation expansion has happened in the more expensive reaches of U.S. and international markets, making a valuation-sensitive argument more potent presently.
Following the 2016 election, U.S. stocks have followed a “Presidential” cycle fairly closely. In a typical four year cycle, the third year (2019) is best and the second year (2018) is worst, with year one somewhat below par and year four generally good but not as good as year three. So far under Trump the pattern mostly fits. Reminiscing about other election years in the course of recent history, it has generally not paid to have much urgency toward investing in the middle months of the year. If a stock looks like it should be bought, we won’t be checking the precise date on the calendar first, but may lean a bit conservative given the more elevated starting point.
A Longer View on Market Valuation and Money Supply as the Driver
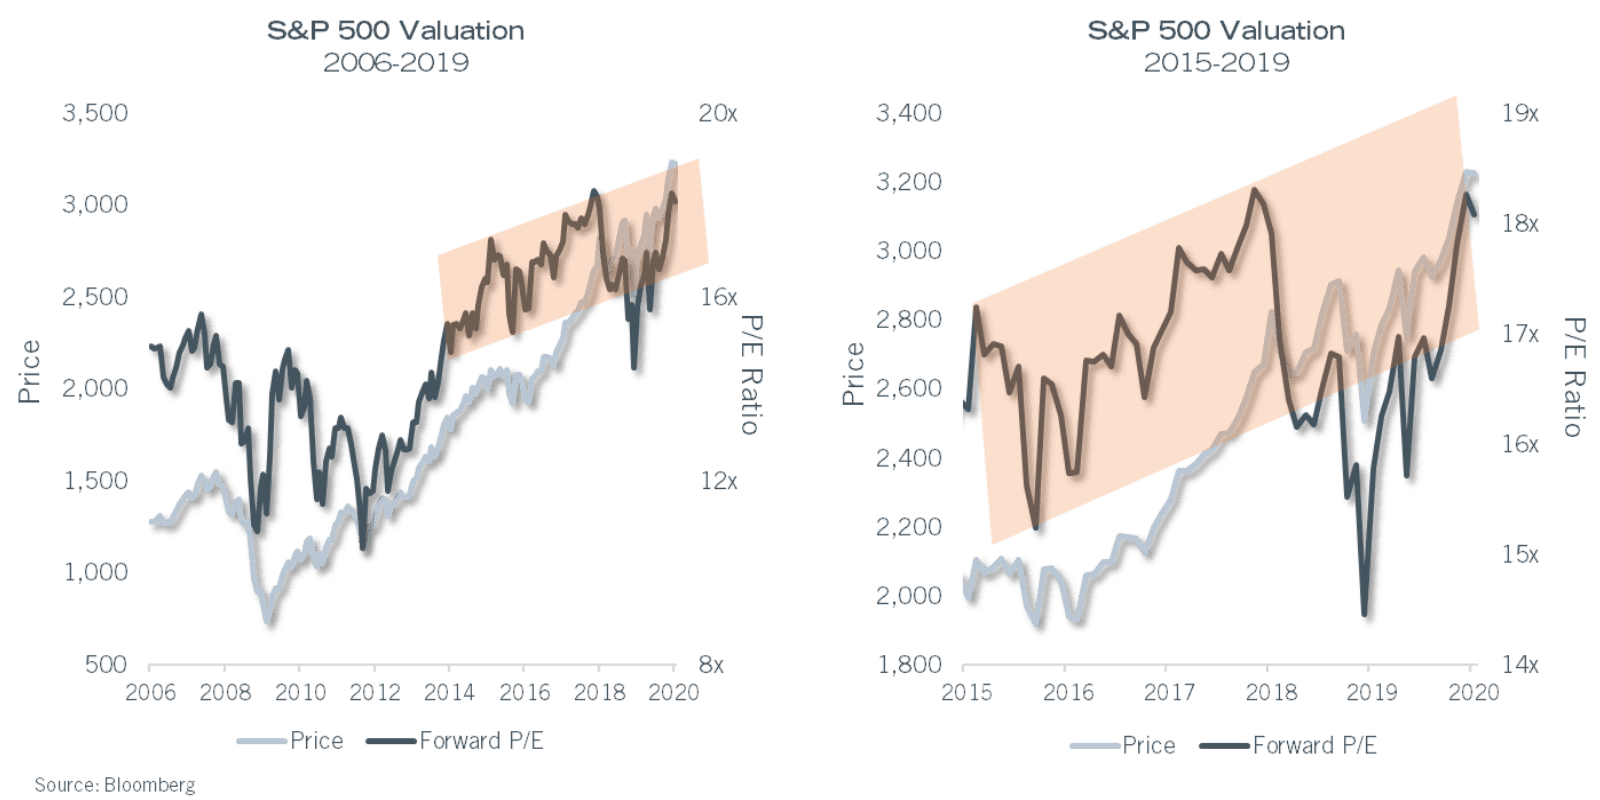 We believe the performance of stocks in the bull market following the 2008-2009 GFC needs to be looked at in two distinct phases. From the 2009 low to the end of 2012, stock prices rose globally as financial conditions healed and corporate earnings recovered. Valuations, strictly speaking, did not recover, with U.S. stocks stuck in a 12x-13x PE multiple range in the 2011-2012 time period, notwithstanding the ongoing economic recovery and very low prevailing interest rates. Perhaps still shell-shocked by the severity of the 2007-2009 time period, investors’ willingness to push up valuations was demonstrably low. Following the 2012 Presidential election, this risk-averse behavior gave way to better risk appetites, and valuations climbed back to levels more consistent with longer-term ranges and prevailing interest rates by the end of 2014. This is visible in the charts we have produced below. For the last six years, U.S. stocks have traded in a relatively tight multiple range of about 15x to 18x forward earnings (averaging 16.8x), with a couple (brief) excursions to the 14x and 19x level. These, incidentally, are where 2019 began and ended, respectively.
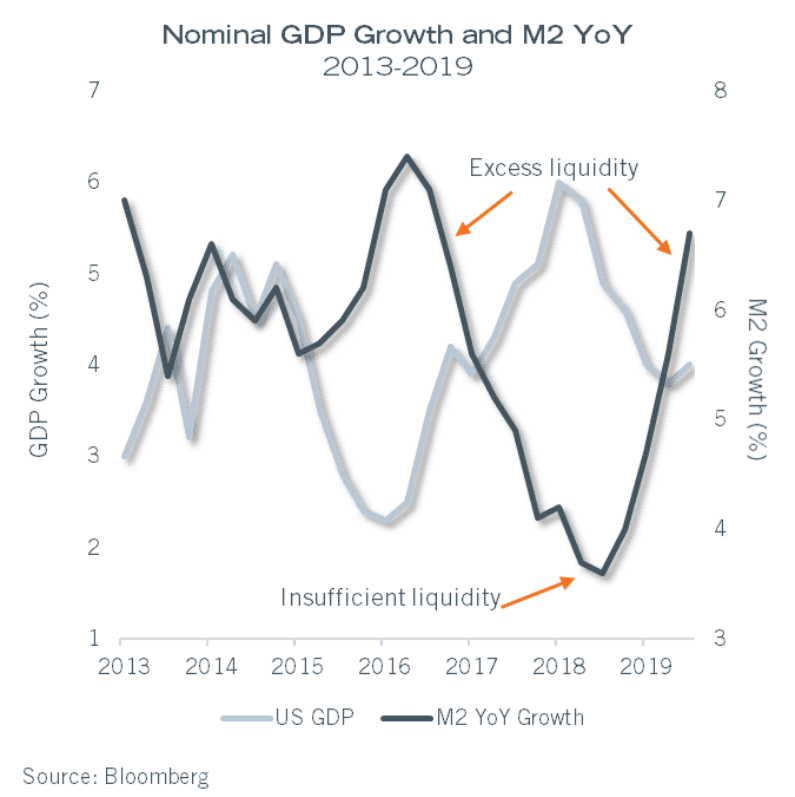 The performance of stocks, and in particular, periods of valuation expansion or compression, have been heavily influenced by Central Bank actions in the 2010s. The year 2019 was no exception to this. A two-phased analysis of the decade is certainly relevant here. For the 2010-2014 time period, the Fed and other major Central Banks expanded their balance sheets materially, bluntly managing around the need for increased monetary reserves in the face of an over-leveraged system pre-GFC and far higher reserve/capital requirements for banks following the various post-GFC reforms and regulations. This led to some non-comparability issues between money supply growth rates, financial returns, and economic performance for the first half of the decade. However, in the 2015+ time period, these relationships have been more stable. At the end of 2018, we urged clients to focus on the relationship between money supply growth (best measured by M2) and nominal GDP. U.S. nominal GDP growth has averaged just over 4% for the whole of the 2010s – subdivided into real growth of 2.2% and cumulative inflation of 1.7% (as measured by the GDP deflator). Money supply/M2 growth has oscillated above and below nominal GDP growth during this period. The U.S. monetary system has averaged 5.5% money supply growth, though with distinct peaks above 7% in late 2016 and more recently at the end of 2019, and a very distinct trough in 2018 to a sub-4% range.
The tight correlation between financial returns to stocks and bonds and money supply growth above and below nominal GDP ranges is called the “Marshallian K”, a reference to a concept of excess systemic liquidity developed by 19th-century economist Alfred Marshall. Provided that money supply growth exceeds nominal GDP growth, there should be excess liquidity, and vice versa and the excess money supply gets into financial asset prices, leading to superior financial market returns, or alternatively inferior returns as liquidity is drawn from financial assets. This has generally been the case in the 2010s and in the more financially stable latter half of the decade but went into reverse in 2018 as the Fed raised interest rates and let its multi-trillion dollar balance sheet roll-off.
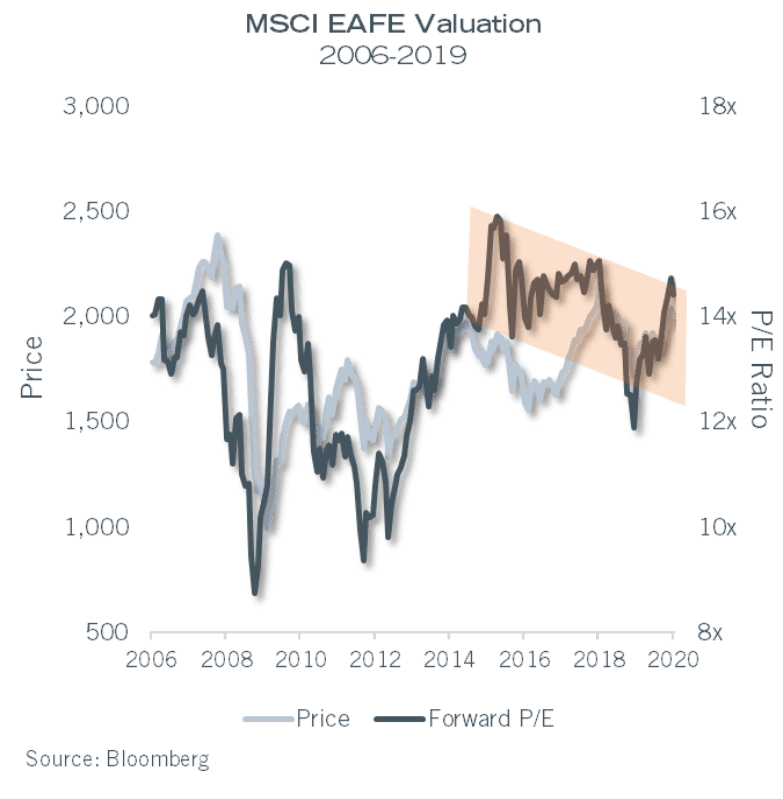 Given the U.S. dollar’s status as the preferred global reserve currency, the world’s collective need for dollars is substantial beyond the U.S.’s physical and financial borders. Just eyeballing the above charts, it appears that a growth rate of ~5.5% or higher is needed to sustain a stable/growing world financial system. The world ex-U.S. is understandably less correlated to changes in dollar liquidity and thus has not shown the same valuation trend-changes relative to U.S. money supply growth. For the moment, non-U.S. valuations seem bounded between 12x and 15x forward earnings, with a couple of brief excursions outside these ranges. The greater question is whether they are bending south durably (a regression suggests that they are in 2015-2020), or if there really isn’t a serious trend.
The money supply pattern in Europe is nonetheless interesting, painting a picture of years and years of deficient money supply growth for the whole of the 2010s – only recently has M2 growth moved above the low 5% range. Perhaps the low cumulative money supply growth factors into the somewhat chronic discounts of European stocks versus global alternatives.
Investment Performance
In the relative return-game that asset managers necessarily play, 2019 was our company’s best year of the decade in terms of decisive outperformance across all the domestic strategies. Cambiar Investors employs a relative-value investment style in its investment management products, which ideally leads to a somewhat wider “strike zone” of investment opportunities versus a traditional value investment approach, though still necessitating an adequate degree of conservatism with respect to embedded valuations and expectations. In a year where growth trounces value (which was the case in 2019), this should favor our results versus conventionally constructed indexes to some extent. That said, the outperformance margins were considerable even given this ambient tailwind.
In international markets, the performance skew of growth over value was very pronounced relative to history. Outside of a brief period in late 1999 to early 2000, we cannot recall a relative valuation differential as wide as it has been for international growth stocks versus value counterparts. Our international investment strategy is built around the same philosophy as the domestic side – seeking good businesses at good prices, with preferences for superior capital discipline alongside the valuation and business qualities. These features have been more difficult to line up in international markets, leading to a modest index-relative performance lag for our international strategies.
We have made internal adaptations in the course of the last several years, which we believe will serve clients well, to be mindful of the challenges of working with a dated template for stock evaluation. The following commentaries represent a material component of our internal rumination along this path. As we enter the 2020s, market structure, valuation versus historical normals, and the inevitable unknowns as technological, political, and demographic factors unique to the present state of the world will coalesce. We would love to believe that we can predict how this goes… but that would be ridiculous.
Is There Really Something Terribly Wrong with Value?
Value as an investment “factor” demonstrated superior results for most of the 20th century outside of a few short-lived bursts in time, such as the late 1990s and late 1960s. In these headier periods, flows and momentum accrued to growthier names, creating significant but not long-lasting periods of lagging results for value. Value predominance continued in the wake of the tech bubble of the 1990s unraveling, but starting around the end of the year 2006, for varied reasons, growth styles of investment have predominated.
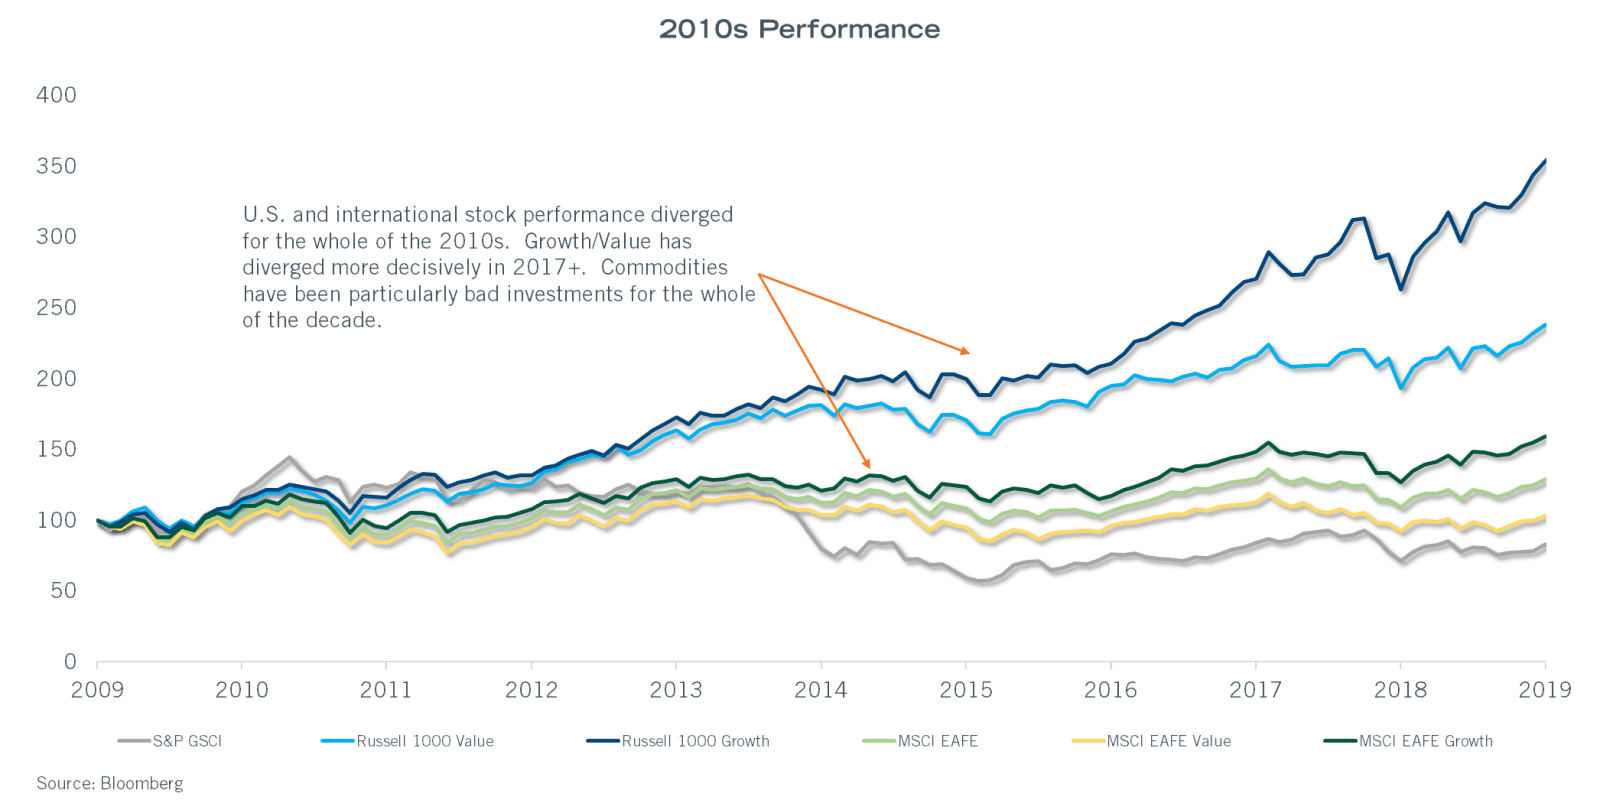
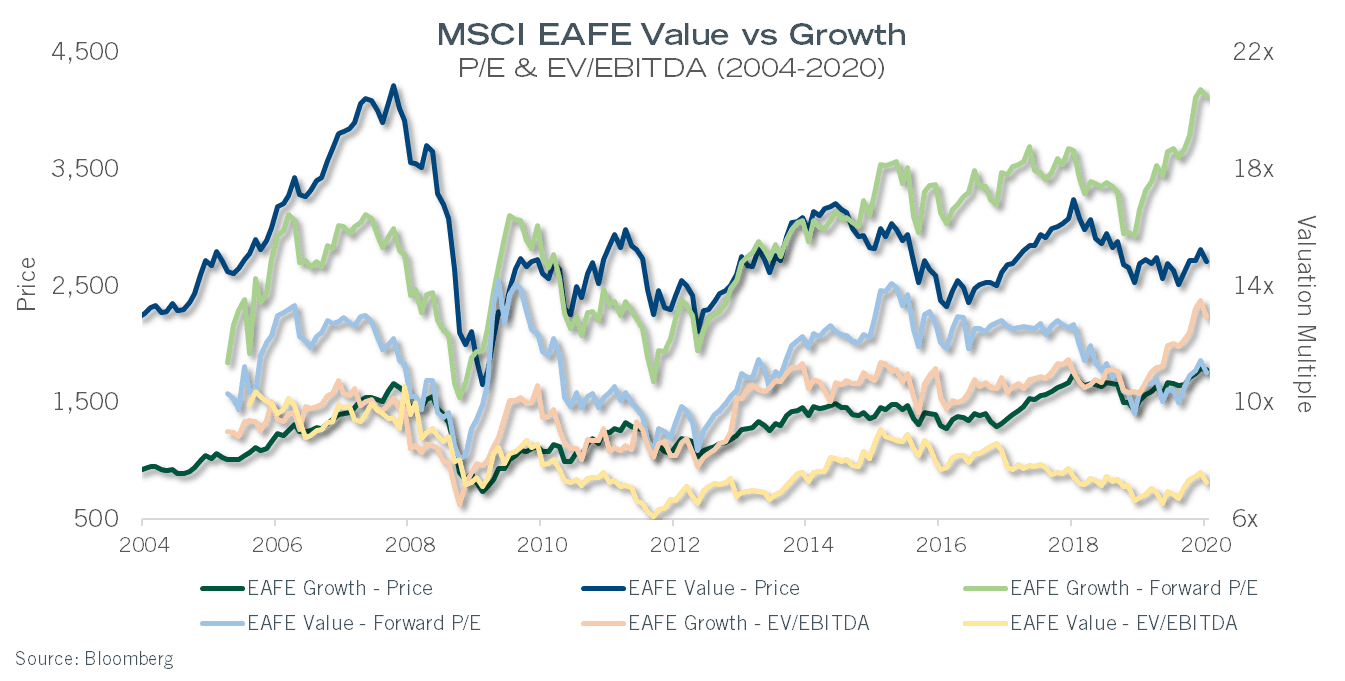
The result has not only been cumulative outperformance but an increasingly bifurcated marketplace. For international stocks, this was particularly extreme in 2019. For most of the 2010s, and even extending back in time prior to the 2007-2009 GFC, growth multiples settled in about three to four points higher than value counterparts, or 20%-35% higher, in both domestic and international indexes. Starting in 2017, these widened out dramatically, to a current gap of almost ten multiple points or just under a 100% premium in international indexes, and by about eight multiple points or roughly a 55% premium in domestic indexes. Both spreads are unusual versus history.
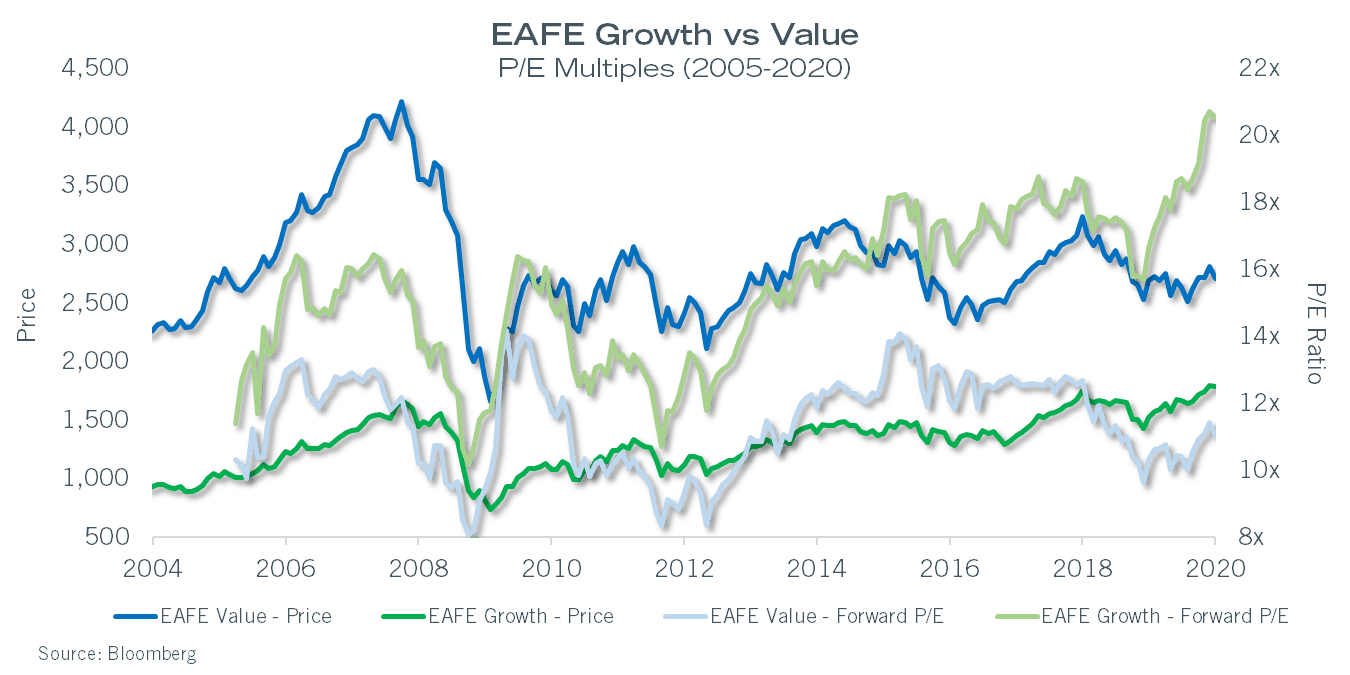
Results are not dissimilar looking at EV/EBITDA multiples over the same time span – value cash flow multiples have actually compressed to lows seen around the peak of Europe’s financial problems in 2011-2012 in the ~7x range, while growth multiples have expanded to new cycle highs of ~13x. Note that the absolute price return of EAFE Value has been minimal, meaning that nearly all returns have come via dividends in a span of ten years!
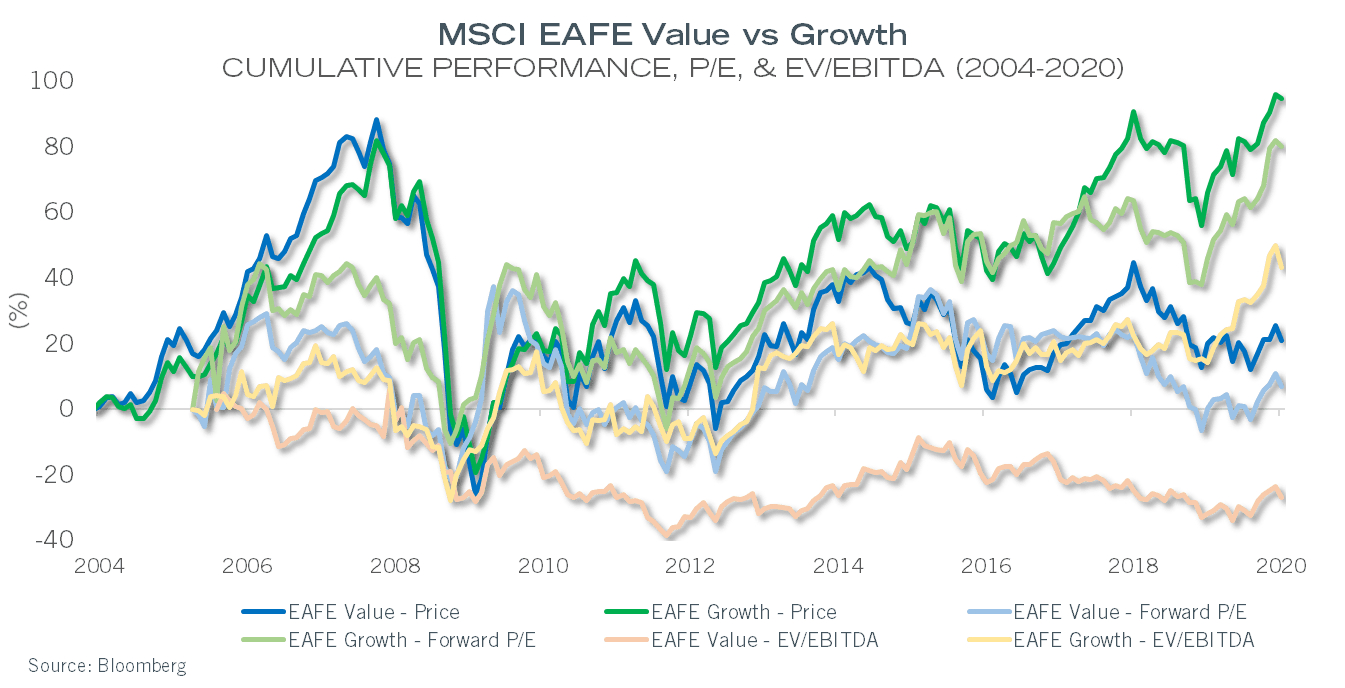
In the below chart we have rebased all these valuation and price index levels to a starting point of zero in the year 2005. We do not have very good data prior to this point; however, would note that global stock market valuations were not particularly elevated at that time, and technology stock valuations had largely compressed back to normal levels versus the 2000 tech bubble. The results paint a picture mainly of valuation inflation in growth categories: growth stock prices are up 91.6% and valuations up 85.3%, while value stock prices have increased by 18.8% on the back of a 9.7% increase in valuation. It would seem the valuation/inflation has drifted very acutely to the growth end of the swimming pool.
Looking at the U.S. stock market, the picture is similar but not necessarily as acute in the last three years. For most of the 2005-2016 time period, growth indices traded some 3-5 multiple points higher, but this spread widened to over eight multiple points in 2019.
Unlike international growth names, which have seen pronounced valuation expansion without much earnings growth, U.S. growth indices have seen a 20% cumulative expansion in P/E multiples during this 15-year stretch. Most of the performance has been earnings-driven, in other words. Value multiples of cash flow have actually fallen slightly (-5%) during this span.
Value Investing In the 2020s
“Value” from a stock analysis perspective is probably not being defined properly, leading to casual and overt errors in terms of business value and margin of safety in a given stock.
For an investment management company committed to a price and valuation-sensitive discipline in some form, the ongoing market preferences for companies that appear to have a strong stake in some version of the future, unencumbered by capital or asset-intensive business models, has become a material challenge. It is evident that new business models, featuring digital platforms and digitalized forms of customer engagement, are quickly outdating traditional/physical models, and we are all certainly spending vast amounts of time in front of electronic screens. It’s not hard to rattle off a long list of business models that appear dated or disrupted by the digital revolution. Some, like record stores and yellow page directories, have long since succumbed to the inevitable, while other heavier employers such as automobiles and department stores remain relevant, but apparently the world needs less of them. For businesses that are entering some form of forced run-off as digital alternatives press deeper into their end markets, the valuation compression of the last 15 years may only be the beginning. Still, this magnitude of valuation discrepancy in the broad marketplace is historically unusual.
Our net conclusion is that “value” from a stock analysis perspective is probably not being defined properly, leading to casual and overt errors in terms of business value and margin of safety in a given stock. There are four or possibly five reasons behind this, though it is difficult to assign a specific percentage of blame to each. From most intuitive to least:
- The academic argument from low rates – The decline in risk-free rates to near-zero levels increases the value of the later years of a discounted cash flow (DCF) calculation, putting growth companies on increasingly superior footing versus value stocks. In a normal DCF, the terminal value calculation is worth ~70% of the total value of a stock. Take the risk-free rate close to zero and that can rise to closer to ~90%, especially for lower volatility growth businesses. Growth is more valuable in a low return world due to its scarcity. However, the boost from a low discount rate may be overstated. Once you get beyond year five of a DCF set of projections, the forecast error range for the values becomes very wide. Can you predict Netflix’s cash flows in 2024? What’s your confidence range? This is a non-trivial fact versus the academic argument favoring growth over value as long as rates are low/falling. That said, looking at an analysis of the correlation between the direction of rates and whether value or growth works better this decade, the R2 is very high based on five-year inflation swaps as a rates proxy. Value has worked much better when rates rise and doesn’t when rates are falling or just low. For the 2010s, risk-free rates fell considerably.
- The tech argument – Another strong anti-value argument is the disruption/disrupted dichotomy particularly with technology-led business moat risks and/or the capacity for loss-leader unicorns to damage the ecology in which slower growth businesses with or without business moats operate. This hypothesis seems to hold some weight, although it’s worth noting that clear statistical validation (that the rate at which technology changes have eroded business moats in the 21st century is greater versus the 20th century) is elusive. There is plenty of anecdotal evidence, but the data is not conclusive.
- Lower fade rate for superior ROE businesses in the 21st century – Historically, companies enjoying higher than average rates of return, typically measured by ROE/ROA/ROCE, have seen such elevated rates of return within their businesses fade over the course of time closer to long term averages. Not all, but enough to create an edge for mean-reversion forms of investing, as some component of the lower return businesses will see returns improve. However, in the current growth over value environment of the last 15 years, the quantitative work argues against mean-reversion. In fact, if you divide the overall stock market into five distinct cohorts of ROCE, the top cohort has seen almost no return fade, while as you move further down in terms of cohorts, rates of fade increase but are not decisive. This is a more powerful and data-driven argument that goes against the historical orthodoxy, favoring higher ROCE businesses (they will continue to compound capital at high ROCEs and not fade) as a more secure form of investing. A quantitatively driven value discipline to some extent presumes the opposite, that lower-return businesses can and may mean revert upwards, and superior return businesses may be expected to fade over a period of years. If this assumption is simply false or heavily overstated, it would favor an emphasis on quality-first (as measured by some durable form of profitability) approach within the confines of price-sensitivity.
- Value is improperly defined because book value excludes intangibles – Most value indices are comprised of lower than average price/book value multiple stocks. Book value is measured based on tangible, depreciated assets minus liabilities. This (we have noted internally) creates a low-return dumpster effect, where the value bucket of the stock market is heavily populated by lower return (on tangible capital employed) businesses. If you consider the above point, that higher ROCE businesses show a surprising resilience to fades in return, and that higher ROCE businesses generally are so because they possess various intangible assets (tech, brand, market position…), and that these intangibles apparently don’t depreciate in quite the same way as physical capital assets do, we probably are using an incorrect definition of book value to determine what does, and does not, belong in the value bucket. Maybe there can be a different definition (excess return specific to non-tangible assets) which can bridge this gap. Yet, it seems reasonably clear that there are data-based problems with a definition of “traditional value investing” as technology and other forms of intangibles permeate the markets.
- Maybe this is all true but greatly exaggerated by heavy indexation – capitalization-weighted indexes weight more heavily those stocks which have risen the most and buy less of those which have not, and as indexation has risen from a teens % of holdings early in the 2010s, it is pushing beyond 50% in 2020. This “reverse price discovery” just adds fuel to the fire and may have exaggerated the already-wide multiple discrepancies.
We will continue to update our thoughts on this topic as and when new data and ideas become available.
Being an investment manager means frequently being intellectually humbled. Financial and industrial trends that lead to powerful investment gains and losses may seem obvious in hindsight, but can be tough to grasp fully as they gradually unfurl.
Looking back over the last decade, if one could have fully intellectually internalized four big observations, it would have really helped results. These are:
- Platformization
- De-Equitization
- Lowflation
- Dollar Supremacy
Platformization
The greatest source of gains over the decade came from internet and technology-driven businesses that successfully evolved into massive global platforms that have become nearly ubiquitous to consumers and businesses. All of the $1+ trillion super cap stocks in the U.S. (Apple, Microsoft, Google/Alphabet, and Amazon) owe their enormity to this phenomenon. It is practically impossible to navigate the world in the late 2010s without a smartphone, and the software and designs for these are largely bottled up into two companies, Apple via the iPhone/iOS, and Google via Android-powered phones. These are classic examples of the “network effect” in action and this, more than patentable technology-specifics, forms the intangible capital assets these companies can monetize. The server and datacenter rooms of smaller to larger companies are rapidly being replaced by remotely connected work environments to cloud-resident applications, with two globally dominant platforms, Amazon’s AWS and Microsoft’s Azure, looking more than a bit similar to the proliferation of smartphones and very concentrated monetization. Away from these very visible giants, platform technology applications such as enterprise software (Salesforce.com and SAP), and technical software (design platforms from Adobe and Autodesk) have ascended well into the $100+ billion market cap range. Outside the U.S., Chinese internet giants Alibaba and Tencent have broached the half trillion dollar market cap range as social media, retailing, and payment platforms. The breathtaking success of platforms such as these has garnered a large share of hopeful new entrants, more willing to lose money at the front end in the hope of eventually achieving ubiquity, such as Uber and Netflix. We have found it difficult to fully reconcile a “we don’t know when if ever” there will be profits model with some form value discipline, but can see how the models could optimally work, and as well the value of scale.
De-Equitization
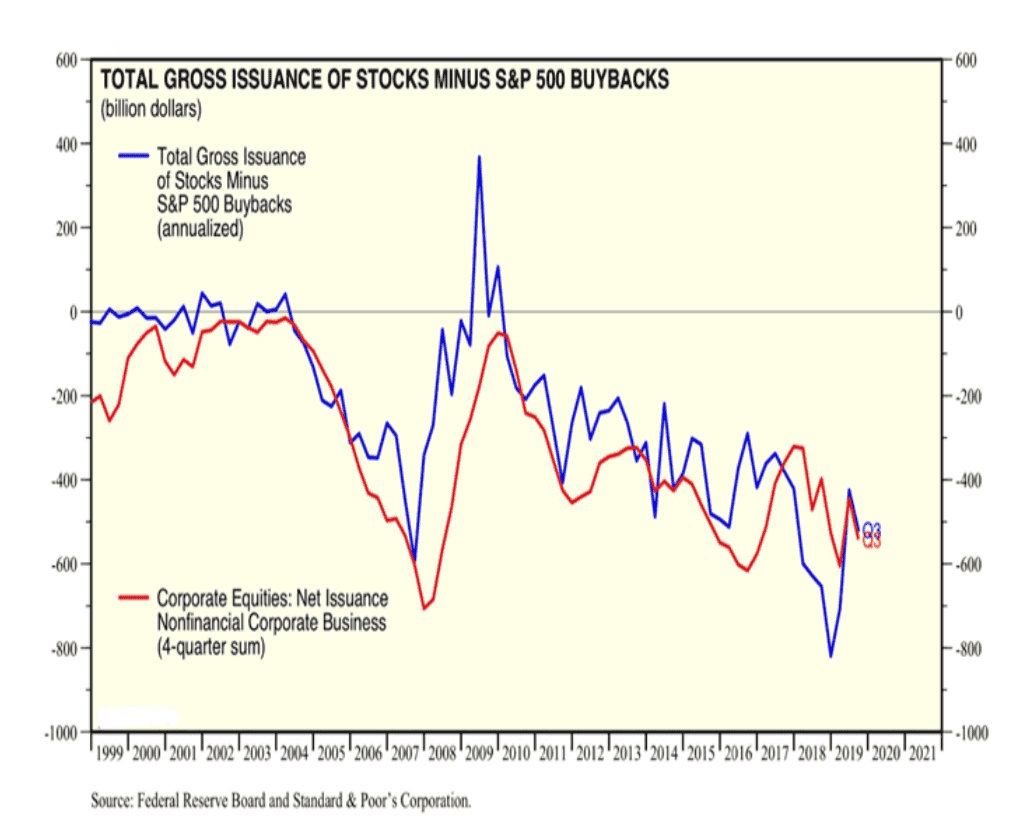
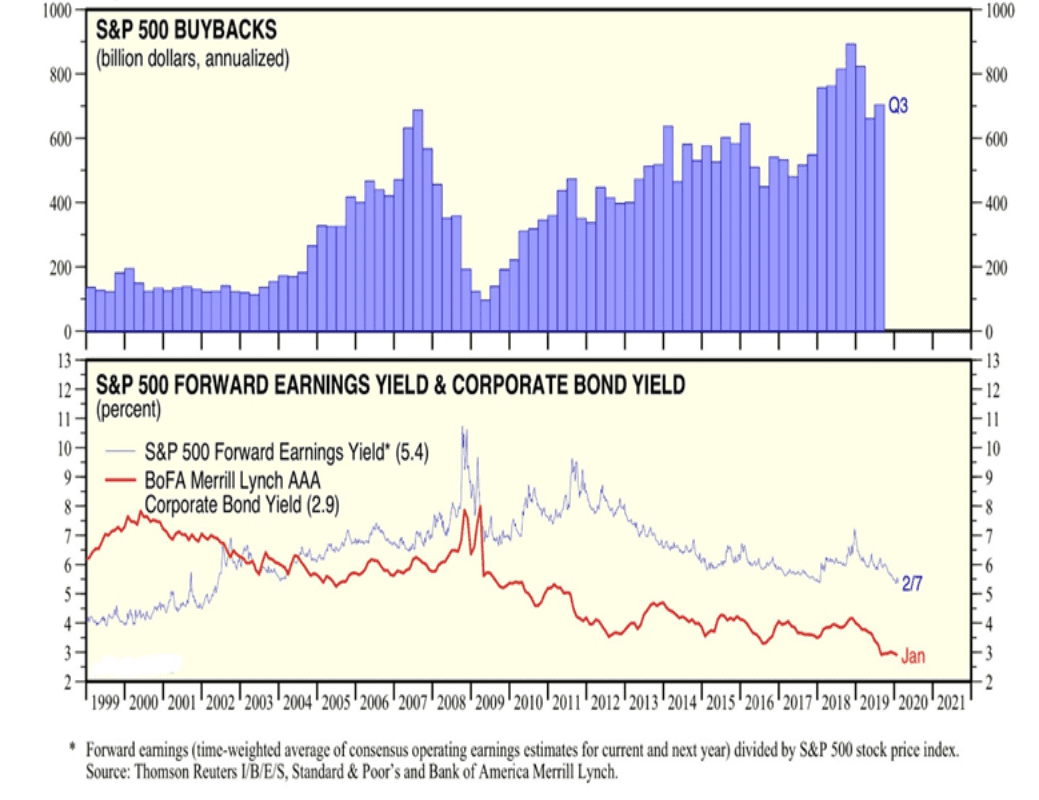 By the early part of the year 2010, a glaring anomaly emerged in the valuation of medium to larger cap businesses. Investment-grade fixed income funding costs plunged to levels not seen prior to the 2007-2009 GFC, and continued to fall through the course of the decade, while price/earnings multiples remained stuck in the low double digits to high single digits for major market participants. Stocks… were cheap, and really, really cheap relative to bonds. With yields remaining through-the-floor low for the course of the decade, larger businesses found it easier to accelerate shareholder returns by either buying their own stock or other company’s. The scale of buybacks over other forms of business capital investment has been impressive over the 2010s – shrinking the total float of the U.S. stock market by trillions of dollars net of new equity issuance, options, and other management/stock incentive programs.
Historically/anecdotally, buybacks have been a less than optimal way for businesses to deploy profits – it’s like un-investing in your business during periods of elevated profitability. But given the challenges of deploying heavy amounts of physical capital in a post-industrial economy, it seems to be working. From a stock returns perspective, an index comprised of the largest net share count reduction stocks has handily outperformed the broader market.
 De-Equitization has also materialized on the debt-side. There is an immense amount of low IG rated debt at the end of the decade, a by-product of financial engineering and M&A-driven growth and consolidation strategies in various sectors post GFC. About 80% of large-cap stocks were not in the low IG or lower (BBB or lower) category prior to 2010 (in other words single A or higher). That has changed – single A and up has declined to just under 60% of the market presently with BBB debt rated corporates now about 30% of the market. Following the next recession, we might almost need a new IG category, “BBB-double minus”, for companies too big to be junk-rated due to what the consequences might be to the supply/demand balance in high yield.
For the curious, the Emerging Markets index blended multiple sits at 12.3x, which sounds attractive until you look at the LT range. It is similarly about one multiple point way from where it tends to top out. This index really needs to be cleaned up given all the state-related companies that reside in it.
Lowflation
For most, if not all of the 2010s, growth in the developed world can be summarized by the acronym SLOG, or structurally lower growth. The precise rate of such growth does differ by country/region, but the trends are fairly clear, and we don’t see a clear case for growth rates to vary a great deal from trend levels prospectively. For the U.S., Europe, and Japan, it’s probably best to consider the Long-Term Trend or “LTT”, and variances around the LTT:
- The LTT growth rate for the U.S. was about 2.0%
- The LTT growth rate for Europe was about 1.0%
- The LTT growth rate for Japan was a bit less at perhaps 0.8%
In a given year, fiscal policies or inventory movements can add or subtract 0.5% to 1.0% to these figures. In our view, the markets tend to over-interpret these variances because the base LTT rates are so low. In other words, if Europe has a down year relative to its LTT because of inventory movements (owing to global trade and idiosyncratic factors) and it shaves about 0.5% off, which cuts growth in half to near recessionary levels. This has been the story in late 2018 and most of 2019, in big Eurozone exporter countries like Germany and Italy – countries big enough to drag the whole region down. Japan has somehow managed to be more stable in 2016-2019. For the U.S., a comparable decline happened in 2016 (commodity crash mostly) and took growth to 1.6%, with cyclicals underperforming. Conversely, U.S. growth zoomed to 2.9% in 2018 on the back of material tax cuts but has fallen closer to the LTT at 2.3% in 2019 as this benefit fades.
With trend growth this low, building any inflationary pressure has been nearly impossible in developed economies, and excess capacity situations in various industries can quickly become problematic to profitability/pricing.
For 2020, current (consensus) estimates for growth are for the U.S. to decelerate back to the LTT of 2% as the fiscal benefit of the 2017 tax cuts fully tapers out. Eurozone growth should accelerate slightly from <1% in 2019 to 1.2% in 2020, ostensibly as comps will be easier and there may be some inventory rebuilding (looking at the European data, growth is a lot better in little European countries like the Balkans and Baltic states – the big ones drag the numbers down). Japan consensus growth is forecasted to reside closer to an LTT rate at 0.6%-0.7%.
With trend growth this low, building any inflationary pressure has been nearly impossible in developed economies, and excess capacity situations in various industries can quickly become problematic to profitability/pricing.
All developed markets have articulated inflation goals of 2%, with a tolerance for something higher than that for a few years to create more monetary policy capacity. These goals appear to be very wishful thinking. Eurozone inflation has never broken above 2% in any post-crisis recovery years and has averaged closer to 1%. U.S. core inflation hit the magic 2% in 2018 but has consistently averaged closer to 1.5% in the 2010s. Japan predictably punches in below 1% inflation but is at least not deflating. Lowflation remains a persistent reality in all developed markets but is more acute outside the U.S.
For these reasons – low LTT/SLOG, lowflation, nobody coming close to making their inflation goal – interest rates remain extremely low with the U.S. at a positive neutral interest rate, while European and Japanese central bankers continue to try to stimulate with negative rates (NIRP) and ongoing QE of varying magnitudes. Smaller central banks in Europe, such as Switzerland and the Nordic countries, are using more substantial negative rates as a form of insect repellent just to keep capital flows out of their home monetary systems.
There is some open question by many investors and economists whether this continues to make sense – if inflation were to accelerate from extensive QE and negative rates, shouldn’t it have happened by now? We are not able to run alternative experiments in real-time and can only speculate, but there is a potential downside to permanent QE and NIRP in that it likely distorts asset prices and risk tolerances, leading to resource misallocation and systemic risks the longer it goes on. There is some evidence to the latter – there is almost no question that persistent low rates have led investment-grade companies to augment their borrowings for M&A or capital structuring. Corporate debt loads in the aggregate are not alarmingly high, but there are clear pockets of excess debt that have been harbingers of poor stock performance, such as specialty pharma a few years ago or consumer staple names more recently. Debt binges are almost always a bad idea.
This is one of several reasons why PE multiples are higher in the U.S. than elsewhere – it’s hard to buck the question of what regional growth rates and financial conditions would look like if central banks stopped trying to reach apparently unreachable inflation targets and focused on more sustainable monetary conditions. Would these countries and their financial systems blow up, or would growth rates just hold in closer to the LTT? Nobody knows, not really. There are some arguments suggesting that the ultra-low rates propagate lowflation by collapsing inflationary expectations and permitting questionable industrial capacity to service debts and persist indefinitely (the zombie company issue). This again is one of those unanswerable hypotheticals.
The persistence of lowflation and ongoing central bank policies to combat it may sow the seeds of the next serious financial problem. The last two global recessions were not caused by an inflationary spurt that needed tight monetary policy to douse. They were caused by asset-price bubbles of varying severity.
Dollar Hegemony
In the decade of the 2000s, the U.S’s combined trade and budget deficits (also called the current account) reached post-WWII highs, which lead to the U.S. sending many trillions of greenbacks abroad to finance these gaps. The dollar has been the world’s primary reserve currency for the last 75 years and this more liberally available supply of dollars led to a megabull market for commodities, ebullient emerging market financial conditions, and a lower trading value (weak dollar) for most of the 2000s. Some speculated the dollar would become much less prominent on the global financial stage, with the Euro and Renminbi possibly gaining in share of reserves.
In the 2010s, no such thing had happened, and if anything, the dollar had become more prominent. There does not, at this time, appear to be any credible challengers to the dollar’s pre-eminent status. Tighter global dollar availability isn’t good for non-U.S. financial returns or conditions.
The roots of this lie in the challenges of the possible contenders for reserve currency share and in the U.S.’s resurgence in the 2010s. Given the persistence of SLOG and lowflation, with these issues afflicting developed market economies to a much greater extent than we have witnessed in the U.S. post-2008, the ECB, Bank of Japan, and peripheral European CBs have gone deep into unconventional monetary policy applications with limited results to date. Negative rates mean it costs money to hold savings in Euros and Yen, and the “what-if” issue of European solvency should unconventional policies be lifted remains difficult to answer. Thus, the Yen and the Euro have limited applicability as reserve currencies. China has not and does not appear able to make the Renminbi freely convertible – money would leak out very quickly if they did, thus it fails the reserve currency test outright.
These not so small issues leaves the dollar alone, and actually earning its holders some seignorage in the process, to dominate reserve currency calculations globally. This means most products – from grains to oil to jet aircrafts to computers – are invoiced in dollars, or “costed” across national borders in dollars, with future buyers and sellers and suppliers hedging into dollars. The network and habits effects are very powerful, and difficult to break. The dollar enters the 2020s more dominant, not less, than it was pre-GFC. That… is not a statement anyone would have believed as U.S. financial markets convulsed in gloom and distress in 2008.

At the end of the 2010s, it is difficult to identify a roadmap to some different version of the world’s strong demand for dollars. Perhaps the best we can hope for is that the U.S.’s current account deficit begins to widen owing to the fiscal side. This… seems possible in the 2020s.
The U.S. has led the world in tech, in financial distress and recoveries, and in novel monetary policies/applications. It seems likely that the U.S. will lead the rest of the world in gigantic structural budget deficits in the 2020s. This is breaking new ground, to have $1 trillion in deficits and unemployment at a 60 year low! There are demographic trends in the U.S. that will almost certainly cause deficits to rise, and politically speaking, the winner of the 2020 election will be a spender, it just depends on who. It is entirely unclear whether deficits of this magnitude are a good thing or an idiotic thing. It does seem to me that the “traditional fiscal conservative” playbook is gone, and the world, for now, needs more/wants more U.S. government debt and the dollar supply this may beget. Combined with some form of renormalization of monetary policy away from negative rates in Europe, this could lead to all kinds of places. Perhaps the dollar becomes less dominant, or at least more widely available, leading to a weaker dollar versus the 2010s. This would be beneficial on balance for international financial conditions.
Certain information contained in this communication constitutes “forward-looking statements”, which are based on Cambiar’s beliefs, as well as certain assumptions concerning future events, using information currently available to Cambiar. Due to market risk and uncertainties, actual events, results or performance may differ materially from that reflected or contemplated in such forward-looking statements. The information provided is not intended to be, and should not be construed as, investment, legal or tax advice. Nothing contained herein should be construed as a recommendation or endorsement to buy or sell any security, investment or portfolio allocation.
Any characteristics included are for illustrative purposes and accordingly, no assumptions or comparisons should be made based upon these ratios. Statistics/charts may be based upon third party sources that are deemed reliable; however, Cambiar does not guarantee its accuracy or completeness. As with any investments, there are risks to be considered. Past performance is no indication of future results. All material is provided for informational purposes only and there is no guarantee that any opinions expressed herein will be valid beyond the date of this communication.